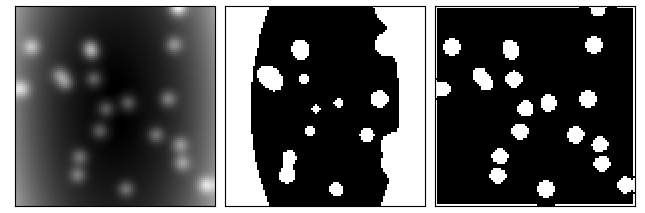
在影像科學中的一個常見應用是將圖像組件從彼此分割開來,這稱為閾值化。傳統的閾值化技術在圖像的背景是平坦的情況下效果很好。不幸的是,這種情況並不常見;相反,圖像中的背景在視覺上會在整個圖像中發生變化。因此,人們開發了自適應閾值化技術,我們可以很容易地在 scikit-image 中使用它們。
import numpy as np
import matplotlib.pyplot as mpl
import scipy.ndimage as ndimage
import skimage.filters as skif
import matplotlib.pyplot as plt
# Generating data points with a non-uniform background
x = np.random.uniform(low=0, high=100, size=20).astype(int)
y = np.random.uniform(low=0, high=100, size=20).astype(int)
# Creating image with non-uniform background
func = lambda x, y: x**2 + y**2
grid_x, grid_y = np.mgrid[-1:1:100j, -2:2:100j]
bkg = func(grid_x, grid_y)
bkg = bkg / np.max(bkg)
# Creating points
clean = np.zeros((100,100))
clean[(x,y)] += 5
clean = ndimage.gaussian_filter(clean, 3)
clean = clean / np.max(clean)
# Combining both the non-uniform background
# and points
fimg = bkg + clean
fimg = fimg / np.max(fimg)

# Defining minimum neighboring size of objects
block_size = 3
# Adaptive threshold function which returns image
# map of structures that are different relative to
# background
adaptive_cut = fimg > skif.threshold_local(fimg, block_size, 'gaussian')

# Global threshold
global_thresh = skif.threshold_otsu(fimg)
global_cut = fimg > global_thresh

# Creating figure to highlight difference between
# adaptive and global threshold methods
fig = mpl.figure(figsize=(8, 4))
fig.subplots_adjust(hspace=0.05, wspace=0.05)

ax1 = fig.add_subplot(131)
ax1.imshow(fimg, cmap='gray')
ax1.xaxis.set_visible(False)
ax1.yaxis.set_visible(False)

ax2 = fig.add_subplot(132)
ax2.imshow(global_cut, cmap='gray')
ax2.xaxis.set_visible(False)
ax2.yaxis.set_visible(False)

ax3 = fig.add_subplot(133)
ax3.imshow(adaptive_cut, cmap='gray')
ax3.xaxis.set_visible(False)
ax3.yaxis.set_visible(False)