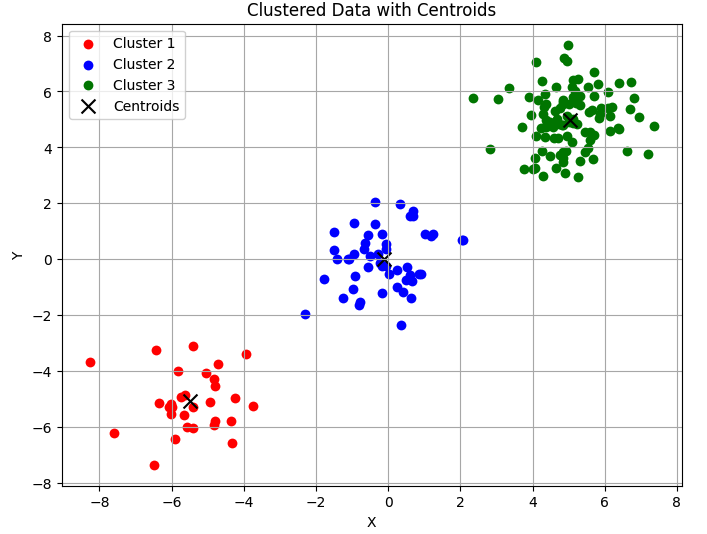
向量量化是一個通用術語,可以與信號處理、數據壓縮和聚類相關聯。在這裡,我們將專注於聚類組件,從如何將數據提供給vq包以識別聚類開始。
import numpy as np
from scipy.cluster import vq
# Creating data
c1 = np.random.randn(100, 2) + 5
c2 = np.random.randn(30, 2) - 5
c3 = np.random.randn(50, 2)
# Pooling all the data into one 180 x 2 array
data = np.vstack([c1, c2, c3])
# Calculating the cluster centroids and variance
# from kmeans
centroids, variance = vq.kmeans(data, 3)
# The identified variable contains the information
# we need to separate the points in clusters
# based on the vq function.
identified, distance = vq.vq(data, centroids)
# Retrieving coordinates for points in each vq
# identified core
vqc1 = data[identified == 0]
vqc2 = data[identified == 1]
vqc3 = data[identified == 2]
# Plotting the clustered data points and centroids
plt.figure(figsize=(8, 6))
plt.scatter(vqc1[:, 0], vqc1[:, 1], c='red', label='Cluster 1')
plt.scatter(vqc2[:, 0], vqc2[:, 1], c='blue', label='Cluster 2')
plt.scatter(vqc3[:, 0], vqc3[:, 1], c='green', label='Cluster 3')
plt.scatter(centroids[:, 0], centroids[:, 1], c='black', marker='x', s=100, label='Centroids')
plt.xlabel('X')
plt.ylabel('Y')
plt.title('Clustered Data with Centroids')
plt.legend()
plt.grid(True)
plt.show()